Abstract
The paper provides an analysis of how income distribution in Senegal changed during the pandemic. It takes data from the wider FES-IDOS-IlO household surveys on informal employment in Sub-Saharan Africa and captures the income situation of people in informal employment in 2019 and 2022. Using nationally representative samples of 1200 households in both years, it shows that agriculture, rural households, and male peasants benefitted from income increases, while urban workers and women in farming lagged behind. The redistribution of income inequality was realized when the government implemented a substantive food aid project during COVID-19 and based its social relief programme on a ‘buying local’ strategy, thereby transferring budget expenditures into local producer income. Linking social relief to local production may be the single most cause to explain why poverty alleviation and income redistribution took place on such a massive scale.
Keywords
Senegal Political Economy, Survey on Informal Employment, Income Inequality and the Pandemic, Social Relief
1. Introduction
Senegal is the second largest economy in Francophone West Africa. Services remain the main contributor to GDP, while agriculture has become the most dynamic engine of growth. The country registered a decade of strong growth of more than 6 per cent before it was impacted by the COVID-19 pandemic. Early 2020 the government introduced temporary lock-down measures, and applied travel restrictions and social distancing to contain the spread of the virus. End of June 2020 the state of emergency was lifted but restrictions were left in place which were temporarily tightened again at the turn 2020/2021 in response to a second wave. Since March 2021, containment policies have been relaxed without being fully abolished.
Economic restrictions and the stop of travel and tourism threatened the economy with a deep recession. To cushion the crash, the government implemented a substantive economic and resilience package of 1,000 bn FCFA or about 7 percent of GDP
. A significant economic slowdown nevertheless set in and real GDP growth stood at 0.87 per cent in 2020, down from 4.4 per cent in 2019, and 6.2 per cent in 2018
. Fiscal support measures however helped the economy to stabilize and recovery returned with GDP growth of 6.1 per cent in 2021 and 5 per cent in 2022.
With macro-economic growth rates back to pre-2020 levels, the economic crisis appears to an intermediate affair already overcome. But not much is known about social disruptions during this pandemic. What happened to income and inequality? How did the economic crises affect the poor? The World Bank in a global analysis of the landscape of poverty reports that “in 2020 alone, the number of people living below the extreme poverty line rose by over 70 million”
, bringing global progress in reducing extreme poverty virtually to a halt. The report shows that income losses were highest for the poorest 40 per cent of the world’s population and that the higher rise of poverty in poorer countries reflects on “economies that are more informal, social protection systems that are weaker, and financial systems that are less developed”
.
Senegal qualifies for the criteria which make economies more susceptible to income loses for the poor during a crisis. It has a high share of informal employment and weak social protection and financial systems. How does the country fit into the global social landscape during the pandemic? Did the country witness a general melting-down of income? Where the poor more affected than the better-off? Did Senegal share in the lot of so many countries or did it manage, to protect vulnerable households and prevent them from falling deeper into misery?
It must be pointed to from the onset that the government of Senegal reacted fast with a solid support policy. In addition to its economic rescue programme, it came up with a voluminous social relief package. Receiving substantial support from international aid the government set up a food aid programme for one million households (CFA 64 billion) to target about half of the population; in addition, utility payments (for water and electricity) for poorer customers were suspended for a 2-month period (CFA 15,9 billion) (IMF). The measures were implemented with efficiency and did reach targeted households
.
A second factor has to be emphasized equally. While COVID-19 containment policies stifled many economic sectors, agriculture was not affected. Favoured by good weather conditions local production witnessed a soaring 23 per cent increase. At a time when economic restrictions worsened income opportunities of many, local food supplies improved.
This article analyses the dynamics of income development in Senegal during the pandemic and tries to achieve two things. It will first compare poverty and income distribution before the pandemic and after its peak and show that in Senegal, contrary to many other countries, both social indicators improved substantially. Many households moved out of extreme poverty and income inequality was greatly reduced. It will then look at possible reasons for this surprising development and come up with the argument that the special way the social relief package of the government was bound to local food production provides the best explanation for radical changes in income distribution.
The analysis uses data from the FES-IDOS-ILO project which included two survey rounds in Senegal in June 2019 and April 2022. The cross-sectional data collection is built on representative samples of people in informal employment and each cover 1,200 households countrywide. The selected sample was achieved by random selection methods at every stage of sampling and the application of probability sampling based on population size. Interviews were conducted as face-to-face interviews in vernacular languages, and answers were documented on tablets, which were preloaded with the questionnaire.
Informal employment was categorized into four main groups. Employers and own-account workers were considered informal when their business was not registered in the national registry for company taxation; they were separated by having at least one regular employee. Employees were grouped as informal if employers did not pay contributions to social insurance schemes. Contributing family workers were defined as informal by default.
Even so the FES-IDOS-ILO survey did not include employment in the formal economy, the matter that informal employment predominates other forms of employment by far allows to conclude that the dynamics in informal employment strongly impact on conditions of poverty and inequality at national level.
To avoid a possible misunderstanding from the beginning a note on the use of the term ‘income redistribution’ is appropriate. ‘Income redistribution is usually understood as an active political action in which the government ‘withdraws parts of the income’ from one group and gives it to another group. This could be done top-down or bottom-up with the help of progressive taxation and social expenditures or other means. The extent of redistribution could be measured as difference between inequality of market income and disposable income. The income data used in this report refer only to disposable income. The term ‘income redistribution’ is used without reference to a specific government policy. Income redistribution is understood in a purely technical sense in that the Gini coefficient or any other inequality measurement has changed.
The report is structured as follows. Section 2 looks at the development of poverty and inequality for the whole segment of informal employment. Section 3 breaks informal employment down into subgroups and identifies losers and beneficiaries of income redistribution by residence (urban-rural), economic sector (agriculture vs other) and educational level. Section 4 focusses on income redistribution from the gender income gap perspective. Section 5 discusses poverty alleviation and income redistribution in the context of social relief and food output and puts the findings into a development perspective. Section 6 summaries the findings of the report.
2. Income Distribution, Poverty and Inequality
2.1. Methodological Note
Income can be measured in various ways and differ in particular in regard to sources, units and whether it is gross or net income. In our approach we define income as disposable income ‘after paying tax and after any contributions were deducted’ and do not distinguish between labour and non-labour income. We focus either on household income, for which the earnings of all members of a household are counted together, or on individual income, which reflects only the income of a single income earner. To care for irregular earning situations within informal employment, we inquired on monthly income as average over six months.
We use two different types of income information. The 2019-survey (first round) asked interviewees to identify their income group from a list of pre-fixed income clusters, which had been arranged as multiples of the statutory minimum wage. The 2022-survey (second round) instead, inquired on the exact amount of the disposable income. While the later round allows to directly calculate statistical results such as mean income or the share of percentiles, the earlier round makes it necessary, to calculate mean income and shares of percentiles with the help of the middle income of the respective cluster as approximation. This procedure blurs the data to some extent as it assumes a uniform distribution within income clusters and our findings are less accurate as they would be otherwise. To care for possible variance from the method, we however do not measure income differences between two years but we focus only on income disparities for each year separately. In this way we are still able to identify the climbing or downswing of groups and sectors in the income hierarchies of 2019 and 2022.
2.2. Income Distribution and Poverty
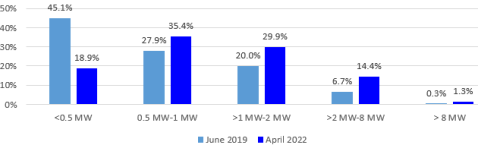
The findings on income distribution by income clusters are summarized in
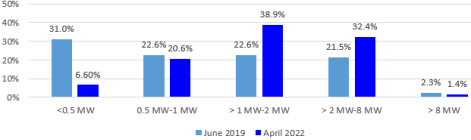
Figures 1 and 2. On both accounts a clear ‘upward trend’ can be observed from 2019 to 2022. In the lowest income cluster (<0.5 MW) representation of individual income decreased from 45,1 per cent to 18,9 per cent while for household income it went down from 31,0 per cent to 6,6 per cent. The opposite trend is visible in the higher income categories. In the cluster >1 MW-2MW, the share for individual income moved up from 20 per cent to 29,9 per cent and for household income from 22,6 per cent to 38,9 per cent.
Figure 1. Monthly individual income in multiples of the statutory minimum wage (MW), June 2019 and April 2022.
N (2019) =1164; N (2022) =1143. Statutory minimum wage (MW) = 55.000 CFA); Income ranges (2022): 2019-ranges increased by 5 per cent to care for inflation.
Figure 2. Monthly household income in multiples of the statutory minimum wage (MW), June 2019 and April 2022.
Poverty is usually measured by household income per capita, a category, which we have difficulty to calculate with the use of income clusters. Assuming that the size of households did not change significantly between 2019 and 2022 and can be treated as constant factor the upward trend in income between 2019 and 2022 already indicates the decline in poverty. Even though we fail to measure the exact number of households, which have to be classified as extreme or moderate poor we can solidly state that the number of extremely poor households is greatly reduced. Poverty declined substantially between 2019 and 2022.
This is not to say that poverty in Senegal has been abolished or become a marginal issue. Transferring our 2022-income data into the international poverty lines as defined by the World Bank we find poverty indices as shown in
Table 1. Despite substantial income improvement, 46.3 per cent of household still have to be classified as extreme poor and another 24,6 per cent as moderate poor. Respective figures for 2019 were however much higher.
Table 2. Poverty by international poverty lines (household income per capita), Senegal.
Poverty lines | Income range $ (2011 PPP) | Senegal Income range (CFA)* (April 2022 | Senegal household income per capita (April 2022) |
Extreme poverty | 0.00–1.90 | 0–13,727 | 46.3% |
Moderate poverty | 1.91–3.20 | 13,728–23,119 | 24.6% |
Lower middle-income class | 3.21–5.50 | 23,120–39,735 | 16.8% |
Upper middle-income class | >5.50 | >39,735 | 12.3% |
2.3. Income Distribution and Inequality
The Gini is one of the best-known measurements to indicate income inequality. Inequality as measured by the Gini coefficient is shown in
Table 1. Between June 2019 and April 2022, the coefficient on account of individual income, fell from 0.53 to 0.45; for household income, the reduction was larger from 0.61 to 0.40. Whatever happened during these years, it ‘washed-away’ substantive parts of inequality and made income distribution ‘fairer’.
The gap between individual income inequality and household income inequality has to be explained by the number of household members, who join in earning activities and contribute to the household income. In 2019, many better-off income earners lived in households who secured additional income from a second or third household members, while poor households mostly registered only one income provider. In April 2022, this effect had turned into the opposite. Households at the lower end of the income hierarchy managed to send more members to income earning activities, thus reducing inequality between households. The economic situation produced an employment effect which privileged lower income earners more than those at the upper end.
Table 1. Income inequality of informal labour in Senegal, June 2019 and April 2022.
| June 2019 | April 2022 |
GINI: Individual monthly income | 0.53 | 0.45 |
GINI: household income | 0.61 | 0.40 |
2.4. Redistribution of Income
The GINI coefficient cannot fall without income redistribution taking place.
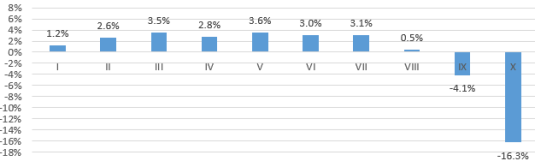
Figure 3 shows the winners and losers of the redistribution of household income by percentiles. As the massive scale in the fall of the Gini coefficient already suggests, income redistribution was not limited to a few households but concerned a large majority. Income winners were the bottom 70 per cent who all increased their share; the eight percentiles remained unaffected as it ‘defended’ its relative position: the losers are found in the ninth and tenth percentiles, whose shares went down by 4.14 and 16.29 percentage points, respectively. Income redistribution between June 2019 and April 2022 was indeed substantive, benefiting the bottom 70 per cent at the expense of the top 20 per cent. Redistribution was largely inclusive, leaving only few households unaffected.
Figure 3. Redistribution of household income between June 2019 to April 2022
3. Winners and Losers of Income Redistribution
Income inequality usually correlates with employment status, the economic sector of activities, the living environment, the educational status and the gender of income earners. We disaggregate our income data with select socio-economic factors, to better identify winners and losers.
3.1. Urban-rural Location
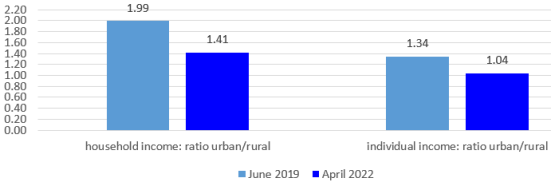
To isolate the residence factor, we compared mean monthly income of households in urban and rural areas. In June 2019, an urban household disposed 1.99 times the income of a rural household; the gap decreased considerably to 1.41 in April 2022 (
Figure 4). Urban households were still better off by a substantive margin, but the income advantage had more than halved. Income redistribution clearly favoured rural areas at the expense of urban dwellers.
The same process can be observed at the level of individual income earners. Informal labour in urban places in June 2019 earned on average some 34 per cent more than what it earned in rural areas. In April 2022, this gap was virtually closed and was down to a mere 4 per cent.
Figure 4. Disparities in mean monthly household and individual income, urban vs. rural areas, June 2019 and April 2022.
It is unusual that income opportunities in rural areas level those in urban areas and specific circumstances must have been at work, to rebalance income opportunities on such a massive scale. As agriculture is the key provider of employment for rural communities, improved rural income opportunities must find an explanation particularly in the performance of farming in 2020 and 2021.
3.2. Agriculture vs Non-agriculture
In terms of employment, Senegal is still largely agriculture-bound (see Section 5 for more on this). Most agriculture takes place in rural communities, joined by some urban farming.
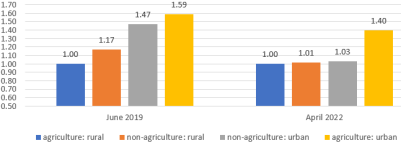
Figure 3 lists the relative changes of individual income of four sub-sectors, which reflect urban and rural locations and separate agriculture from the catch-all category ‘non-agriculture’. The income earned in the sub-sectors is presented as variance of income earned from rural agriculture.
1) In June 2019 rural agriculture was the worst income performer. Peasants earned 17 per cent less than other rural income earners and 47 per cent less than urban dwellers. These gaps were closed by April 2022 and rural agriculture was ‘as lucrative’ as other economic activities, be it in rural or urban places.
2) Urban agriculture stands out as top earner. This is due to the appropriation of a locational rent. Urban agriculture saves on expenses for transport and marketing and can ‘pocket’ higher produce prices. That income advantages in 2022 narrowed from 59 per cent to 40 per cent may be linked to land area shortage, which impede urban agriculture to expand production when demand goes up.
Rural agriculture is the main beneficiary of income redistribution. It improved its income opportunities to the level of activities in other parts of the economy, including urban locations. Insofar as agriculture is characterized by small holdings (see section 5), peasants stand out as main winners of income redistribution between June 2019 and April 2022.
Figure 5. Disparities in monthly mean individual income by various categories, June 2019 and April 2022 (rural agriculture = 1.00).
3.3. The Educational Factor
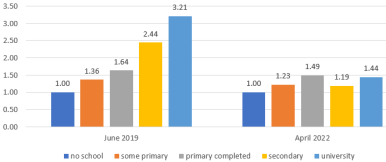
Education is usually linked with income in that higher school certificates earn better income. We grouped respondents into five educational classes, and compared income levels with school certificates. The findings are shown in
Figure 6.
1) June 2019 indicates a high concurrence in income and education. The higher the educational achievement, the higher the income. A university degree provided an income 3.2 times higher than the income of a person who never attended a school. The link exists at all levels but is particularly strong for secondary school and university leavers.
2) The picture in April 2022 differs completely. Finishing primary school still delivered a higher income than shorter or no school attendance, but beyond, the relative gain had vanished and income and education were delinked. Secondary school certificates and university degrees produced no additional income any more. The premium which usually comes along with longer school visits had been eradicated.
A core group of losers in income redistribution between June 2019 and April 2022 are persons with higher educational status. Two reasons may explain this process: (a) people with higher educational status are mostly engaged in services and were side-lined from the income bonanza in agriculture; (b) people with higher educational status have work often in towns. Insofar they may have benefited less from multiplier effect in rural areas and were more confronted with closing-down measures during the pandemic which were particularly manifest in urban locations.
Figure 6. Disparities in monthly mean individual income by education of income earner, June 2019 and April 2022.
4. Gender Inequality and Income Redistribution
Gender inequality is a major dimension of socio-economic life. There are many ways to measure it. The Global Gender Gap Report of the World Economic Forum
lists nine dimensions and includes gender disparities such as in industry leadership, political representation and wealth accumulation. In this report, we focus on gender inequality as reflected in labour participation and income disparities.
4.1. The Gender Pay Gap: Mean Income and Hourly Income
Women may have a higher or lower participation rate in informal employment in terms of numbers or working hours which may affect their share of income. To control for unequal representation, we look at two pay indicators: (a) mean income takes care for different numbers of men and women in informal employment; (b) mean hourly income controls for different working hours spent in income earning activities.
Table 2 summarizes the findings on gender income inequality. At the level of monthly mean income, men earn 43 per cent more than women. This may be called the gross gender income gap. The gap is composed of two components. The first part refers to working hours. Men spent 14 per cent more working hours in informal employment than women (44.2 hrs vs. 38.6 hrs.) and accordingly should have a higher income by that rate. The second part reflects differences in hourly earnings. If we divide total income by working time to get the hourly earnings, men earn 25 per cent more than women. This may be called the adjusted or net gender income gap. Overall, the gross gender income gap is caused by about two-thirds from lower earning per working hour and about one-third by less working hours.
Table 2. Gender income disparities in mean monthly income and hourly earnings, April 2022.
| male | female | male/female |
mean monthly income (CFA) | 90,412 | 63,129 | 1.43 |
weekly working time (hours) | 44.16 | 38.61 | 1.14 |
hourly earnings (CFA) | 471 | 378 | 1.25 |
N (male) = 462; N (female) = 543. Respondents only considered if they responded to weekly working time and monthly income.
Note: Hourly earnings calculated as total monthly income / total monthly working hours. Weekly working hours transformed into monthly working hours by the multiplicator: 4.345.
We have no reason to assume that on the whole, women work less than men. If we assume for the sake of the argument gender parity in working time, then women spent less time in informal employment because they spent more time outside informal employment without earning income. They would be over-represented in subsistence production, in particular in agriculture including cultivating plants in gardens, where food stuff is produced for home consumption; or they spent considerable time in domestic work, such as cooking and cleaning or in care work of the young and the elderly for which again, they are not paid. We did not inquire on unpaid work time, and cannot quantify gender representation in subsistence production and domestic and care work. We can however state that gender discrimination reaches beyond the issue of disparities in earning rates and equally includes disparities between paid and unpaid work.
4.2. Gender Income Inequality: On the Rise
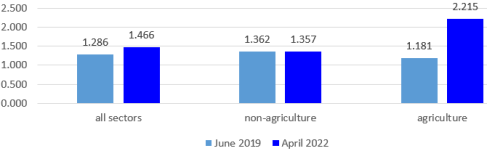
What happened with gender income inequality between 2019 and 2022. Did the gender pay gap decrease and follow the general inequality trend during this period? Or did it widen and counteract other income changes? To relate the results to the previous findings on income development in agriculture, we distinguish gender income gap by economic sectors (agriculture vs. non-agriculture). The findings are shown in
Figure 7.
1) the gender income gap widened between June 2019 and April 2022 from 1.29 to 1.47. Income redistribution which reduced overall income inequality impacted on gender relations in a negative sense. Inequality between men and women deepened.
2) In business activities in non-agricultural sectors, no change in gender inequality is observed. The mean income inequality ratio remained untouched, implying that men and women benefitted in the same manner from the redistribution of income.
3) In agriculture, the gender pay gap nearly doubled and jumped from 1.18 to 2.22. Whereas gender inequality in agriculture in 2019 was modest, it has exploded until April 2022.
Figure 7. mean monthly income by ratio male/female, June 2019 and April 2022.
Note: The pay gap of 47 per cent in 2002 is slightly higher than the previously shown pay gap of 43 per cent (
Table 2). The difference is caused by the method of calculation. We can however assume that the method used equally ‘inflates’ the pay gap for 2019, so that the changes in the gap are not ‘biased’ by the method.
Overall, we can conclude that gender income pattern remained untouched outside of agriculture. Whatever occurred, happened to men and women in the same way. Within agriculture however, a substantive discrimination was at work. Men profited substantially more from income increases between June 2019 and April 2022 than women. Subsequently, gender inequality worsened. The output boom bypassed women and led mostly to large income increases for male peasants.
5. Reducing Income Inequality – Context and Sustainability
The analysis on income redistribution so far led to ‘surprising’ findings of which two are particularly striking: (a) during the first two years of the pandemic, informal employment witnessed a dramatic redistribution of income in favour of agriculture which reduced overall income inequality considerably; (b) beneficiaries of income redistribution were mainly male peasants while female peasants were bypassed to a large extent. These findings have to be assessed within the socio-economic and socio-political context within which income changes occurred.
5.1. Boom in Agriculture
An income increase in agriculture is unlikely to occur without a corresponding output growth. Supported by favourable weather conditions agriculture in 2020 achieved a soaring growth of 23.4 per cent
. The following year, agriculture did not only keep its momentum but witnessed an additional growth of 4.6 per cent. Taking the two pandemic years together, agriculture did not only sail well through the crisis, it even managed to increase its sectoral share in the economy. When other economic sectors were stifled by policy restrictions, agriculture was subjected to a bumper harvest.
The contribution of agriculture to employment is substantive. Even though the urbanisation rate of Senegal is high, a majority of its population of more than 17 million, is still living in rural communities (2021: 52.6 per cent), having agriculture as key economic activity. In 2021, agriculture contributed just above 15 per cent to the GDP; its share in the labour force is substantially higher, caring for some 30 per cent of total employment
and some 60 per cent in rural areas
.
Property ownership is a key factor in spreading production and earnings. Senegal does not have many large land holdings and most farming is done by peasants. Insofar as they supply markets, they do it as informal economy operators. Peasant farming keeps inequality in land ownership within limits, but the same does not apply if looked at from a gender view. There are only few sex-disaggregated statistics on land for Senegal but they show that gender inequalities in land ownership exist and women’s share is substantially lower whether land is owned solely or jointly. Not much data are available to compare male and female labour but judging from studies in other countries, differences are likely to exist as well in regard to crop specialization. Male peasants with larger farms usually concentrate on cash crops with high market potentials while women with smaller plots focus on food production for home consumption. Eventually, a bumper harvest which washes in higher income from increased output would accordingly bypass female-dominated semi-subsistence farming and fully materialize in male-dominated cash crops. Structural imbalances turn into gender discriminate and favour men to women. Reducing the gender income gap in agriculture and pushing for a gender-balanced income distribution may not work without doing away with production constraints for women.
5.2. Organizing Monetary Demand Through Social Relief Measures
The output boom in agriculture did not emanate from Government policies and was not influenced by actions undertaken by public authorities. The marketing of food products however was.
An increase in production cannot automatically be equated with higher producer income. During harvesting time, food prices usually fall. In 2020, the increased food harvest met buyers with depleted income from the enactment of COVID policies. Without strengthening the consumer’s purchasing power, the higher food output may have led to a fall in producer prices, thereby preventing producers from earning higher income. Details on how producer prices at farm gates evolved during the pandemic are not (yet) available and we cannot show the extent to which peasants were able to transfer stable food prices into improved earnings. Judging from our income data, we can however assume that they succeeded well in turning the output boom into an income boom, even though this was mostly limited to the male peasantry.
Here, the social relief package comes into play. When food kits were distributed to more than 1 million households or half the population, the government never intended its action as policy measure to turn income inequality around, nor did it designate food aid as poverty alleviation. When the government however linked the purchase of food kids to local production, she turned budget expenditures into peasant’s income. We have no information on the extent to which the government bought food products for its COVID relief programme from importers or from local markets. Food imports increased from 2019 to 2020 by 18 per cent but food purchases were put to public tender, which allowed local wholesale traders to participate and later, replenish emptied stocks with local supplies. Judging from income development in agriculture, a substantial share of the distributed food aid must have come from local production. ‘Buying local’ transferred budget expenditures into monetary demand for home produce, kept food prices up and increased income. Linking social relief to local production may be the single most cause to explain why poverty alleviation and income redistribution took place on such a massive scale.
5.3. Redistribution of Income as One-off or Lasting Effect
The full story on what happened to income development during the Pandemic is not yet written and more factors may be disclosed to have contributed to the positive outcome. While we are convinced that the ‘buy local’ approach for the social relief strategy will remain the key explanation the question arises as to whether income redistribution is a one-off effect which will soon varnish and be overtaken by former income realities again; or whether it will be a lasting process which will keep peasant’ income up. It is difficult to draw conclusions.
In theories of economic development, an agriculture-led growth path has long been recommended and strong arguments are forwarded to expand an economy by first promoting agricultural productivity and increasing peasant income. Increased purchasing power of food producers is a requirement to create an internal market, to which a domestic manufacturing sector can be linked. Senegal has a large dependency on food imports and a market for local food sales is superabound.
This is not the place to assess, if the social relief policy of ‘buying local’ for food aid is already a manifestation of a revised, well-considered agricultural promotion strategy or has been implemented as ‘policy by chance’ as opportunities were given. Even then, the experience during the pandemic shows that a strategy to promote the rural economy works. But Senegal has come to a position of points and may pursue a different path. It has joined other African countries in a search for natural resources and discovered substantive gas reserves, from which exports are due to start in the next years. The gas reserves are already the target of intense interest by European countries which try to find alternatives to Russian gas
. With a gas export boom around the corner Senegal is faced with new challenges. A resource curse may loom and ‘a Dutch disease’ be in the making which changes relative prices in favours of imports and above all ‘punishes local producers. When rent income from resource exports is not ‘neutralized’ and urban consumption becomes even more dependent on imports, hopes for an agriculture-led growth path will falter.
6. Summary
Contrary to many other countries, where Corona-19 resulted in the swelling of the numbers of the poor, Senegal sailed well through the first two years of the pandemic. The government came up with a voluminous social relief programme which reached a majority of informal labour households and set the framework for a substantive reduction in poverty and income inequality within informal employment. The report identifies winners and losers of income redistribution and comes to several conclusion. Beneficiaries were rural communities which managed to narrow down the income gap to towns and cities. Within rural areas, peasants emerged as the main winners. They succeeded in pushing their mean income to the level of earnings in other economic sector. Income redistribution was realized when the government based its social relief programme on a ‘buying local’ strategy, thereby transferring budget expenditures into local producer income. Multiplier effects from the spending of peasant income widened the circle of beneficiaries to other rural groups engaged in trade and transportation. The government did not justify the social relief measures with the need to reduce income inequality but the necessity to keep vulnerable household from falling deeper into poverty; government policy did not intent income redistribution but the way it was enacted worked to this effect.
The pandemic years did not benefit all but losers can be identified as well. (1) The urban informal economy was largely bypassed by the production boom in agriculture, making urban income losing out against rural earnings. (2) Outside agriculture, no gender effect in income distribution during the pandemic can be observed; inside agriculture however, gender effects were massive. Women in agriculture became the key loser of the re-allocation of income during the pandemic. From a small 12 per cent (2019) the gender income gap within the farming community opened to a huge 122 per cent disparity, indicating that the male peasantry was able to monopolize most gains. As a result, the overall gender pay gap increased substantially, from 29 per cent in 2019 to 47 per cent in 2022, all of which had agricultural income as driver. While not object of the survey, the key explanation for this development must be found in the agricultural production relations, in particular in land ownership and market integration. Women held back in semi-subsistence agriculture were hardly touched by the foodstuff buyouts of the government leaving male peasants as key group to benefit.
The full story on the dynamics of income development in Senegal during the pandemic is not yet written and more studies must be undertaken to disclose all facets. We are however convinced, that the ‘buying local’ strategy and the transfer of budget expenditures into peasant’s income lies at the bottom of the immense income redistribution which occurred between 2019 and 2022.
Will ‘improved rural producers’ income become a stable structural feature or will peasants slip down the income hierarchy again depends largely on the question, if the government is willing to implement an agriculture-led growth policy, joined by a reform programme to rebalance farm ownership in favour of women. With substantive foreign currency earnings from gas exports around the corner, the positive experiment with a ‘buy-local strategy’ may soon be forgotten and a ‘Dutch disease’ may be in the making which changes relative prices in favour of imports and ‘punish’ local production.
Abbreviations
AfDB | African Development Bank |
CFA | Communauté Financière Africaine |
FAO | Food and Agriculture Organization of the United Nations FES Friedrich-Ebert-Stiftung |
IDOS | German Institute of Development and Sustainability |
ILO | International Labour Organization |
IMF | International Monetary Fund |
KFW | Kreditanstalt fuer Wiederaufbau |
MW | Minimum Wage |
PPP | Purchasing Power Parity |
Author Contributions
Rudolf Traub-Merz is the sole author. The author read and approved the final manuscript.
Conflicts of Interest
The author declares no conflict of interest.
References
| [1] |
African Business (16. Sept. 2022) Senegal seeks to cash in on global dash for gas. Available at:
https://african.business/2022/09/energy-resources/senegal-seeks-to-cash-in-on-global-dash-for-gas/
|
| [2] |
FAO [n. d.] The gender gap in land rights. Available at:
https://www.fao.org/3/I8796EN/i8796en.pdf
|
| [3] |
ILO (2021) International Labour Organization, ILOSTAT database. Data as of January 2021. Available at:
https://data.worldbank.org/indicator/SL.AGR.EMPL.ZS?end=2019&locations=SN&start=2001
|
| [4] |
Mané, Cheikh (2016) Gender and Market in Senegal. August. Available at:
https://documents.wfp.org/stellent/groups/public/documents/ena/wfp287874.pdf
|
| [5] |
Ndij, David (2022) Africa’s Infrastructure-Led Growth Experiment Is Faltering. It Is Time to Focus on Agriculture. December. Carnegie Endowment for International Peace. Available at:
https://carnegieendowment.org/2022/12/20/africa-s-infrastructure-led-growth-experiment-is-faltering.-it-is-time-to-focus-on-agriculture-pub-88662
|
| [6] |
ILO (2019) Women and men in the informal economy: A statistical picture.
|
| [7] |
Traub-Merz, Rudolf / Öhm, Manfred / Leininger, Julia / Bonnet, Florence / Maihack, Henrik (2022a) A Majority Working in the Shadows. A six-country opinion survey on informal labour in sub-Saharan Africa. Friedrich-Ebert-Stiftung/German Institute of Development and Sustainability / International Labour Organization. Available at:
https://www.fes.de/referat-afrika/publikationen
|
| [8] |
Traub-Merz, Rudolf (2022b) Poverty and Inequality During the Pandemic. The diverging experiences of Kenya and Senegal. September 2022. Available at:
https://www.fes.de/referat-afrika/publikationen
|
| [9] |
WB (2021) World Bank, Poverty & Equity Brief. Senegal, April. Available at:
https://databankfiles.worldbank.org/public/ddpext_download/poverty/987B9C90-CB9F-4D93-AE8C-750588BF00QA/AM2020/Global_POVEQ_SEN.pdf
|
| [10] |
WB (2022) World Bank, Poverty and Shared Prosperity 2022. Correcting Course. Available at:
https://openknowledge.worldbank.org/server/api/core/bitstreams/e6eccf97-3c1e-54f1-ab74-ee091ab73559/content
|
| [11] |
World Economic Forum (2022) Global Gender Gap Report 2022. Insight Report. July. Available at:
https://www3.weforum.org/docs/WEF_GGGR_2022.pdf
|
| [12] |
Xinhua (20.04.2020), available at:
www.xinhuanet.com/english/africa/2020-04/29/c_139016363.htm
|
| [13] |
AFDB: Senegal. Macroeconomic outlook. Available at
https://www.afdb.org/en/countries/west-africa/senegal/senegal-economic-outlook
(visited 10.02.2023).
|
| [14] |
AFDP: AfDB approves 88 million euros emergency budget support for COVID-19 response. Available at:
https://www.afdb.org/en/news-and-events/press-releases/senegal-afdb-approves-88-million-euros-emergency-budget-support-COVID-19-response-35864
(visited 09.02.2023)
|
| [15] |
FAO (04.02.2021) Senegal published the Annual Agricultural Survey 2019-2020 report, providing data and information on the country’s agricultural sector. Available at:
https://www.fao.org/in-action/agrisurvey/news-and-events/detail-events/es/c/1372696/
(visited 08.02.2023).
|
| [16] |
IMF: Policy Responses to COVID-19. Senegal, available at:
https://www.imf.org/en/Topics/imf-and-COVID19/Policy-Responses-to-COVID-19
(visited 08.02.2023).
|
| [17] |
KFW (23.10.2023) Senegal: "Team Europe" sets Corona Emergency Aid on the Way. Available at
https://www.kfw-entwicklungsbank.de/International-financing/KfW-Development-Bank/About-us/News/News-Details_606720.html
|
| [18] |
WB: The World Bank in Senegal. Available at:
https://www.worldbank.org/en/country/senegal/overview
(visited 28.12.2022).
|
| [19] |
WB: World Bank financing helps to support Senegal in the fight against COVID-19, available at:
https://www.worldbank.org/en/results/2021/08/31/world-bank-financing-helps-to-support-senegal-in-the-fight-against-COVID-19
|
| [20] |
WB: WITS, World Integrated Trade Solution, available at:
https://wits.worldbank.org/CountryProfile/en/Country/Sen/Year
|
Cite This Article
-
APA Style
Traub-Merz, R. (2025). Reducing Income Inequality During the Pandemic: Findings from Countrywide Household Surveys on Informal Employment in Senegal. American Journal of Theoretical and Applied Statistics, 14(6), 277-287. https://doi.org/10.11648/j.ajtas.20251406.13
 Copy
|
Copy
|
 Download
ACS Style
Traub-Merz, R. Reducing Income Inequality During the Pandemic: Findings from Countrywide Household Surveys on Informal Employment in Senegal. Am. J. Theor. Appl. Stat. 2025, 14(6), 277-287. doi: 10.11648/j.ajtas.20251406.13
Copy
|
Download
AMA Style
Traub-Merz R. Reducing Income Inequality During the Pandemic: Findings from Countrywide Household Surveys on Informal Employment in Senegal. Am J Theor Appl Stat. 2025;14(6):277-287. doi: 10.11648/j.ajtas.20251406.13
Copy
|
Download
-
@article{10.11648/j.ajtas.20251406.13,
  author = {Rudolf Traub-Merz},
  title = {Reducing Income Inequality During the Pandemic: Findings from Countrywide Household Surveys on Informal Employment in Senegal},
  journal = {American Journal of Theoretical and Applied Statistics},
  volume = {14},
  number = {6},
  pages = {277-287},
  doi = {10.11648/j.ajtas.20251406.13},
  url = {https://doi.org/10.11648/j.ajtas.20251406.13},
  eprint = {https://article.sciencepublishinggroup.com/pdf/10.11648.j.ajtas.20251406.13},
  abstract = {The paper provides an analysis of how income distribution in Senegal changed during the pandemic. It takes data from the wider FES-IDOS-IlO household surveys on informal employment in Sub-Saharan Africa and captures the income situation of people in informal employment in 2019 and 2022. Using nationally representative samples of 1200 households in both years, it shows that agriculture, rural households, and male peasants benefitted from income increases, while urban workers and women in farming lagged behind. The redistribution of income inequality was realized when the government implemented a substantive food aid project during COVID-19 and based its social relief programme on a ‘buying local’ strategy, thereby transferring budget expenditures into local producer income. Linking social relief to local production may be the single most cause to explain why poverty alleviation and income redistribution took place on such a massive scale.},
 year = {2025}
}
Copy
|
Download
-
TY  - JOUR
T1  - Reducing Income Inequality During the Pandemic: Findings from Countrywide Household Surveys on Informal Employment in Senegal
AU  - Rudolf Traub-Merz
Y1  - 2025/12/31
PY  - 2025
N1  - https://doi.org/10.11648/j.ajtas.20251406.13
DO  - 10.11648/j.ajtas.20251406.13
T2  - American Journal of Theoretical and Applied Statistics
JF  - American Journal of Theoretical and Applied Statistics
JO  - American Journal of Theoretical and Applied Statistics
SP  - 277
EP  - 287
PB  - Science Publishing Group
SN  - 2326-9006
UR  - https://doi.org/10.11648/j.ajtas.20251406.13
AB  - The paper provides an analysis of how income distribution in Senegal changed during the pandemic. It takes data from the wider FES-IDOS-IlO household surveys on informal employment in Sub-Saharan Africa and captures the income situation of people in informal employment in 2019 and 2022. Using nationally representative samples of 1200 households in both years, it shows that agriculture, rural households, and male peasants benefitted from income increases, while urban workers and women in farming lagged behind. The redistribution of income inequality was realized when the government implemented a substantive food aid project during COVID-19 and based its social relief programme on a ‘buying local’ strategy, thereby transferring budget expenditures into local producer income. Linking social relief to local production may be the single most cause to explain why poverty alleviation and income redistribution took place on such a massive scale.
VL  - 14
IS  - 6
ER  -
Copy
|
Download